70% faster: rewriting the API that serves most of our traffic
At the beginning of 2017, we decided to revamp our catalog API which is one of the main parts of our infrastructure, as it’s the API that serves 60 to 70% of our overall traffic.
The catalog API provides a way to access our product offering. Broadly, it serves three categories of data:
- static pages (https://en-ae.namshi.com/women/)
- product details (https://en-ae.namshi.com/buy-anaya-patchwork-detail-kaftan-for-women-kaftans-263349.html)
- product listing with search and suggestions (https://en-ae.namshi.com/women-clothing-arabian_clothing/)
Static pages, which are HTML files prepared by our content team, are stored on the file system. The product details are a set of product-specific information; the bulk of that information is stored in Redis so that we only have to go to the database to fetch stock availability for a particular product (as we want that to be real-time and extremely accurate). Product search and suggestions are powered by Solr, using keys based on product category, brand and so on.
We had two main goals for the rewrite: better performance and more ease of extensibility. In this post, we talk about how we managed to achieve those goals and our overall journey moving the products catalog API from our legacy PHP application to a Node.js microservice.
Why did we decide to rewrite it?
Our catalog API was built on top of our initial, chubby API layer powered by Symfony2 — a single repository hosting a few other functionalities of our architecture, like checkouts and customer profiles, all deployed as a single building block.
As the months went by, we decided to shift towards microservices and go for a rewrite because:
- a new, clean implementation is free from other dependencies, not tied to our shared API layer.
- we could move away from PHP: as much as the language and platform have evolved since we started using it (we started with PHP 5.3, the PSR-0…those times!), we feel that other platforms provide a “nicer” development experience.
- we’re very bullish on gRPC as the next-gen standard for communicating among microservices, and that wasn’t easy to support with our legacy implementation. Furthermore, even though that’s bound to change, you cannot build gRPC servers in PHP as only the client-side part is implemented.
We could go on and mention a whole bunch of other reasons but, fundamentally, it all boils down to the fact that we needed to move away from our shared API layer. It served its purpose very well, allowing us to do RAD with very little overhead, unified deployments and shared dependencies. As the number of services grew larger and larger we decided to shift the complexity from the code (imagine maintaining an app with many responsibilities) to the architecture (imagine maintaining X apps with 1 responsibility): time to extract the beast!
(if you are interested in why we didn’t start with microservices to begin with, we’d recommend having a look at Microservices: not a free lunch on High Scalability and Microservice tradeoffs by Martin Fowler)
Why NodeJs?
We’ve banked on JavaScript for quite some time, as we realized it’s the lingua franca that everyone’s able to speak. Software engineers get comfortable fairly quickly with it, and with ES6 and async/await (which we use through node --harmony-async-await), the language looks less of a weirdo 😃
Another reason to pick it was the fact that NodeJS is quite fast, especially for I/O heavy applications because it naturally handles I/O in a non-blocking manner, giving us a high throughput.
How fast? Well, fast enough.
We look at milliseconds, not microseconds, when we want to optimize the performance of our services, so having a platform that lets us efficiently schedule work concurrently is all we need. The fact that we’re running in a “VM” (as opposed to the request-response-death model of traditional PHP deployments) lets us do some performance optimizations with objects we need to re-use across requests — and we will explain those in detail later in this post. Let’s just say that we want a platform that can serve a sizable chunk of our HTTP requests within 20ms or less, and NodeJS does it very well.
What we think JS sucks at is that large codebases tend to become unmaintainable, so we’ve made it our goal to never end up with a large JavaScript codebase. Most of our applications are microservices deployed on Docker containers, and re-writing good chunks of them won’t require more than a few weeks: we believe this leads to manageable JS applications, without needing Typescript, 100% test coverage & the likes.
Our answer to how to grow a JS codebase? Don’t grow it, split it!
Design
Architecture
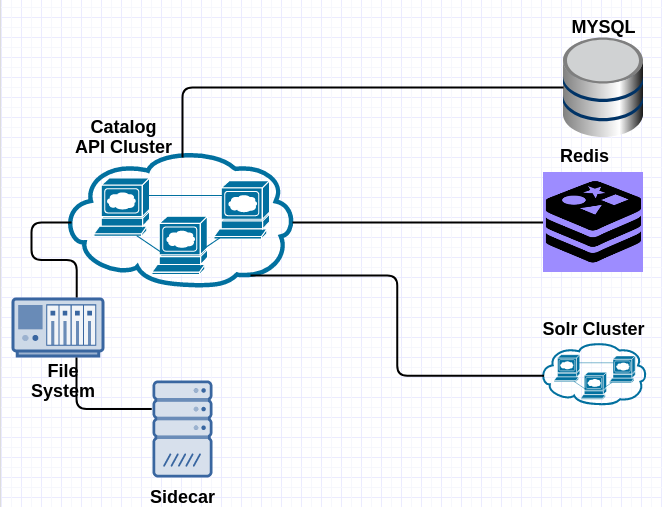
The architecture consists of a cluster of Node.js applications running within docker containers each of which are capped to 1 GB of RAM and 50% of 1 CPU core. We use Kubernetes to handle auto-scaling of our application. We have a Kubernetes configuration that handles automatically scaling our application once the CPU usage reaches 40% of 1 CPU core. We also have a Redis cluster (in ElastiCache) alongside a highly available Solr cluster.
Sidecar is a container running beside each instance of our catalog API, responsible for downloading the static HTML files from Amazon’s S3 when we want to update our static pages. It first downloads them to a shared volume and then notifies the catalog API by creating an update lock file: the application is always checking for the existence of this lock file and, once it finds it, it will clear the internally cached static files. You can checkout our open source s3-sidecar.
The tools we use
Memoization
A lot of our requests generate high number of cache misses, primarily because of small differences between requests, and we used to have a reverse proxy layer, powered by Varnish, that would serve cached results to around 20/25% of the requests. In order to simplify our architecture we decided to remove this layer (all in all, we didn’t have a high hit-rate) and use application level cache (through memoizee) extensively, caching data used to service the request rather than caching the response itself.
For example, we preload some data which doesn’t change frequently, then save it in memory and update it at intervals — this reduces the number of times we need to call external systems such as Redis, and speeds up the response time. Worth to note that we also use memoizee to cache our Solr request and, as much as we thought of putting Varnish in front of Solr, we eventually realized we didn’t need such complexity.
Redis Pooling
Instead of creating a new connection to Redis every time we need data, we created a connection pool to manage and reuse connection to Redis: the pool will keep a minimum number of open connections, and make sure we don’t exceed the maximum number of connections set in our configuration. This way we can keep less connections open, and scale them up fairly quickly when the app gets hammered by more traffic.
(We used the generic-pool module to avoid re-inventing the wheel 😃 )
Redis Client Proxy
In order to centralize error, timeout and response handling when we interact with Redis, we added a proxy layer on top of the widely used redis module, so that acquiring a connection, executing an operation and releasing the connection are abstracted away, with a promise-based interface: we released this as an open source redis wrapper that contains both pooling connections and the proxying calls to redis.
Going live
You know how live deployment should be? Boring as hell, and we’ve embraced this philosophy when rolling out this new API: the adrenaline of clicking the red button and rolling out the service at once is tempting, but the software engineer in you knows that it’s best to go live incrementally, fully prepared, aware of all the risks and ready to yawn as everything goes as expected.
Before going live, we decided to take a dual approach at benchmarking: first we would make sure that responses were “fast enough”, then that they were “scalable enough”.
Being “fast enough”
It’s generally easy to think of the operations a piece of code is doing and say “hey, this shouldn’t take more than 5 milliseconds”, and that’s what we exactly did: we simply rolled out to staging fairly early on and started doing some load testing with vegeta.
After looking at the results coming from vegeta, we would then analyze them and figure out if they seemed reasonable to us: does GET /some-content involve calling Redis a couple times? Then it shouldn’t take more than 5 milliseconds. Does GET /product1.html need to fetch stock data from a slower DB? Then we should definitely be within 20/30 milliseconds. Is node taking more than 15 milliseconds on a particular route? Then we probably need to look at the way our code is organized, search for unneeded loops, and optimize.
NewRelic was instrumental during this phase, as we were able to see if we were hitting other layers too many times:
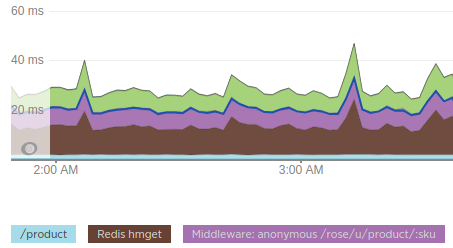
Why is Redis taking 10 milliseconds? Are we hitting it multiple times? Can we batch requests together and instead of sending 3 HGET we simply issue 1 HMGET? Those were the kind of things we were looking at the time. By doing so, we optimized chunks of our code and were ready to take it to the next level.
A note on the computational cost of abstractions
Lodash is a very popular JavaScript library that provides generic abstractions to solve various problems. One of them is the “pick” function which is used to pick a property from an object.
It turns out that this convenient abstraction comes at a cost.
Normally getting a property value from an object in JavaScript cost O(1) on the average case, but lodash’s pick’s implementation costs a O(n) on all cases where n is the length of properties within the object; in our case, we were looping over hundreds of products and the delay in performance was not acceptable, so we opted to lose the abstraction provided by lodash in this regard.
Being “scalable enough”
Now, we’re no fools (or at least we like to believe so!), so we were sure that doing a bunch of “static” benchmarks with vegeta wouldn’t really tell us how the application would behave in production, where the amount of traffic and the variety of requests are very different.
We started testing the “elasticity” of the app: take down all instances but one and start bombing it with incremental traffic, so we can observe how it reacts to an increase in traffic. We did so with a silly bash script that would send X requests for a few minutes, give the service a break, then send 2X requests, 3X etc. This showed that the app could easily adapt to different levels of traffic, and we could focus on the next step.
Even though we now realized the app could take on a higher load without suffering too much, our tests were still too unrealistic: we were probing a few, known URLs, whereas live traffic would be spread across many different URLs — products with 1 size, multiple sizes, products with many different related products, categories with very few products, categories with a plethora of products and so on. Replaying live traffic was a must.
Luckily, we discovered goreplay a couple years back and fell in love with it. It lets you replay TCP traffic from one host to another one, without much overhead (it doesn’t act as a proxy, it just analyzes network packets and replays them, kind of a tcpdump on steroids). We then scaled up our staging cluster and replayed most of our live traffic to staging, observed the metric and let the replay run for hours and eventually days, until we were comfortable that the new app could sustain the live traffic very well.
We finally decided to deploy the application to production, but did not switch everything to the new API in one go as that could have brought down our entire website in case there were any issues that we hadn’t caught in the previous stages. So we went for the boring partial deployments approach: we kept the old app running and we started progressively switching traffic to the new app.
First, we picked the country with the least amount of traffic, then monitored the app, fixed the small bugs that would occur and repeated that same process for each one of the countries we serve until all the traffic was switched to the new app — the whole process took about two weeks. Yeah, it’s boring.
Results
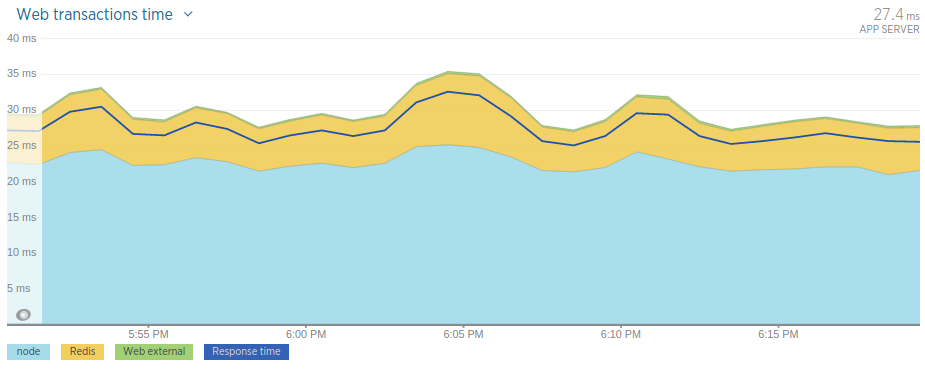
Now comes the time to show what we were able to achieve in terms of performance improvement. In the old application, our average response time was around 82 milliseconds.
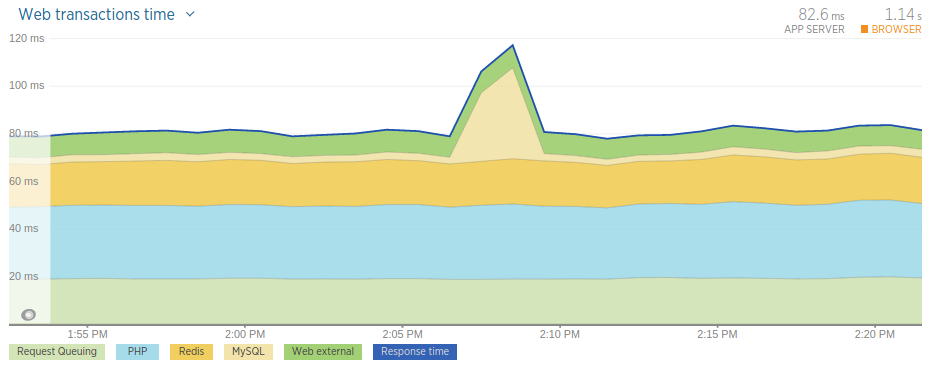
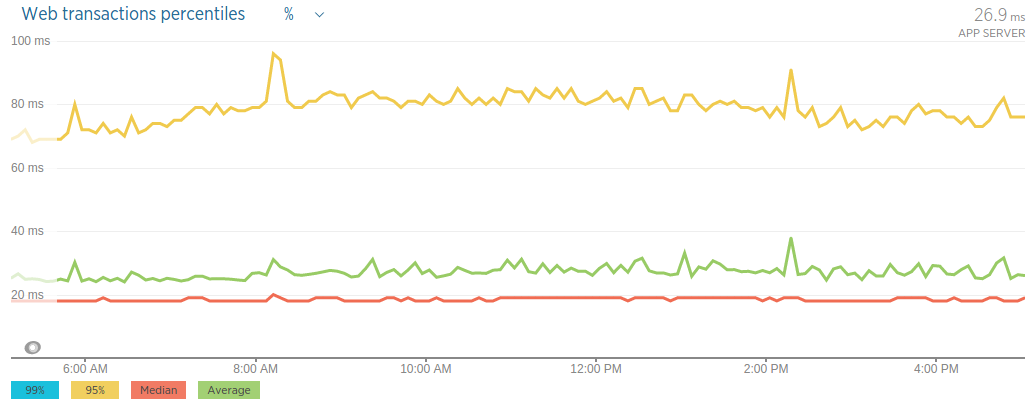
In the new application we managed to achieve an average response time of around 27 milliseconds — that is a 67% performance improvement:
Since averages can be misleading let’s look at the percentile graph of the new application’s response time data.
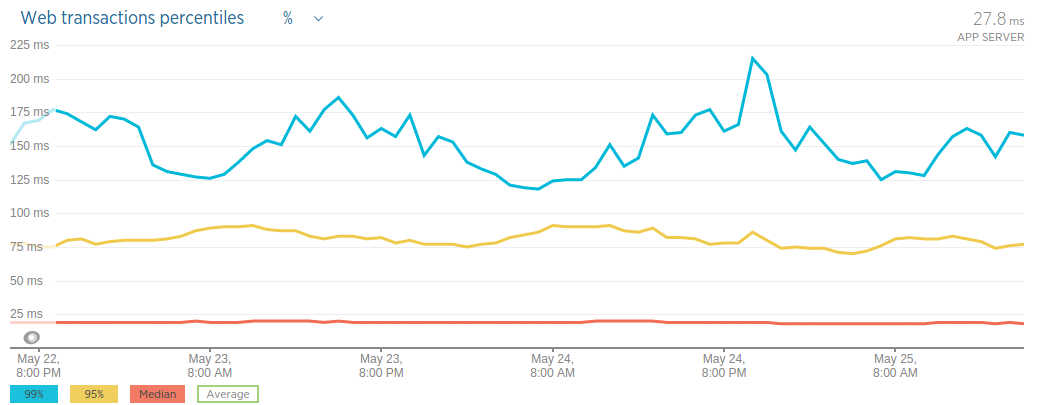
What the graph above tells us is that 50% (red line) of our requests are served under 20 milliseconds and 95% (yellow line) of them are served below 100 milliseconds.
Using an histogram we also see the same pattern.
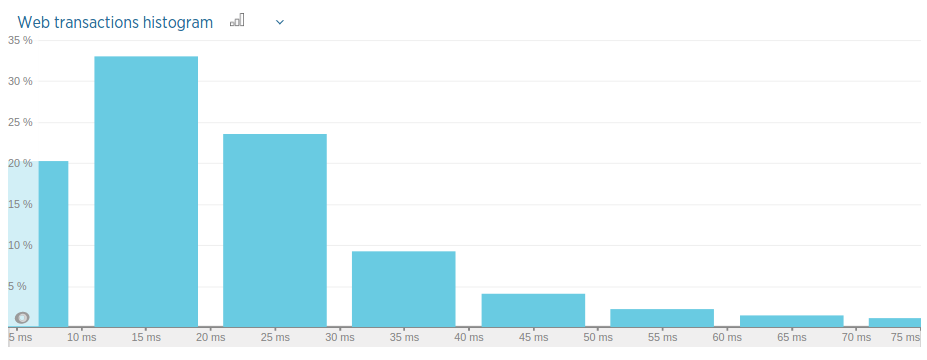
Basically, according to the histogram above, 20% of our requests are served within less than 10 milliseconds, and 53% of them are served within 20 milliseconds.
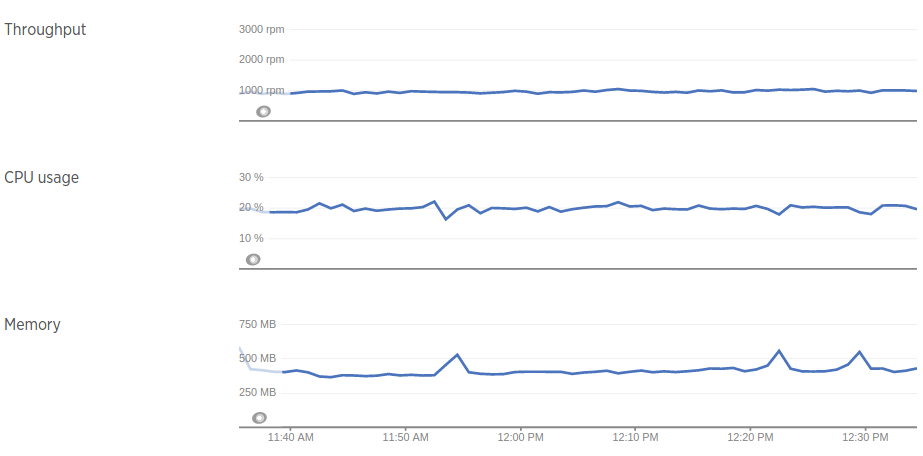
Now let’s look at the improvements in terms of resources utilization: as indicated in the graph below, our old PHP application used to consume about 25% of 2 CPU cores and 4 GB of memory. We went live with the new application on April 12, hence the considerable drop in resource consumption that you see in the graph.
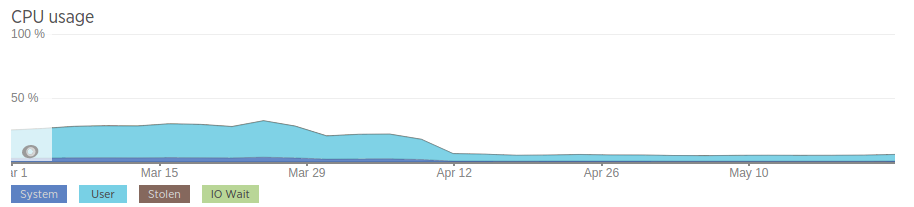
The new application however as you can see in the graph uses way less resources. The graph below is for one of our host, which serves around 1000 rpm (requests per minute), and uses half a CPU (capped by k8s) with a memory limit of 1 GB. You would agree that’s a huge improvement on the old application!
What’s Next?
We are really happy with what we have achieved so far with the rewrite of the catalog’s API. As we move forward, we would like to keep improving it — as we do for all of our codebase — by introducing appropriate tools and technologies. For example we would like to upgrade to node 8 so that we can take advantages of some nice features such as async and await (without relying on harmony flags). We are also exploring the idea of using gRPC in order to improve how we do distributed systems overall.
If what you read here sounds interesting to you and you would like to build cool stuff with us, please come join us.
This article has been a joint effort between the backenders that revamped our catalog API between February and April 2017: Ayham and Joe.