Moving from Prometheus to StackDriver… …and introducing the StackDriver Pushgateway
When running a business, being able to compare metrics to other time period helps to understand which way things are moving and take actions based on that. For example, a sudden decrease in conversion rate is something you would definitely want to monitor, and take action based on.
At Namshi, we are saving a bunch of “business” metrics and storing them in prometheus, with alerts based on conditions over those metrics (for example, if hourly_visits < X: trigger an alert).

We have hundreds of applications and cronjobs, periodically sending metrics to prometheus using the pushgateway, which collects metrics and makes them available to prometheus.
In order to send metrics from our crons etc we can simply curl to the pushgateway:
echo "my_metric 99" | curl --data-binary @- http://PROMETHEUS_GATEWAY_ENDPOINT/metrics/job/my_jobThe alerts are defined with k8s configmaps, such as:
kind: ConfigMap
apiVersion: v1
metadata:
namespace: kube-system
name: foo-alert
labels:
role: alert
data:
foo.rules.yaml: |
groups:
- name: foo
rules:
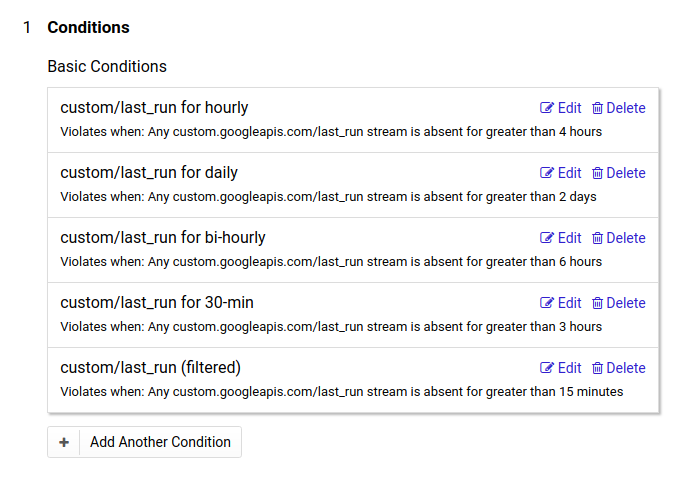
- alert: Foo cronjob is not running
expr: (last_run{job="foo"} - unix_ts) > 86400
for: 1h
labels:
some: thing
annotations:
summary: Foo cronjob not running
description: Foo cronjob is not running, this will affect xyz, you can fix by doing a,b,c
alertname: Foo cronjob not runningEverything has been running fine until we started facing some issues related to managing the infrastructure around prometheus, which is not funny: instead of spending time managing prometheus, we could shift our efforts towards our core business.
Google came up with StackDriver, which seems to fit our bill: SD has a monitoring service as well as and alerting service which allow us to send metrics and create alerts based on those metrics.
To send business metrics to StackDriver, we would have needed to do the following for every single app in our cluster:
- mount google credentials
- install StackDriver dependencies
- structure the metrics as time series as mentioned here and send them back to SD. For more details, have a look at the documentation
(if we were running on GKE we could have avoided step #1, as Google auto-mounts credentials on its own instances)
At Namshi we have hundreds of services, and doing that for every service would have been painful: the solution we came up with was to create something similar to the prometheus pushgateway, where we could just send the metrics to a gateway, and the gateway will then send those metrics back to StackDriver. We built a “StackDriver pushgateway”, and the effort that took us to migrate all services to StackDriver was as simple as changing the endpoint of the gateway.
Interested by sending business metrics to StackDriver? Good news, as we open sourced the Stackdriver pushgateway!
To start sending business metrics to StackDriver, here are the 3 simple steps:
- get credentials from google cloud console
- define your project id with an environment variable
- deploy it and start sending metrics using simple http requests:
echo "some_metric 99" | curl --data-binary @- http://STACKDRIVER_GATEWAY_ENDPOINT/metrics/label1/value1/label2/value2Have fun monitoring on StackDriver :)